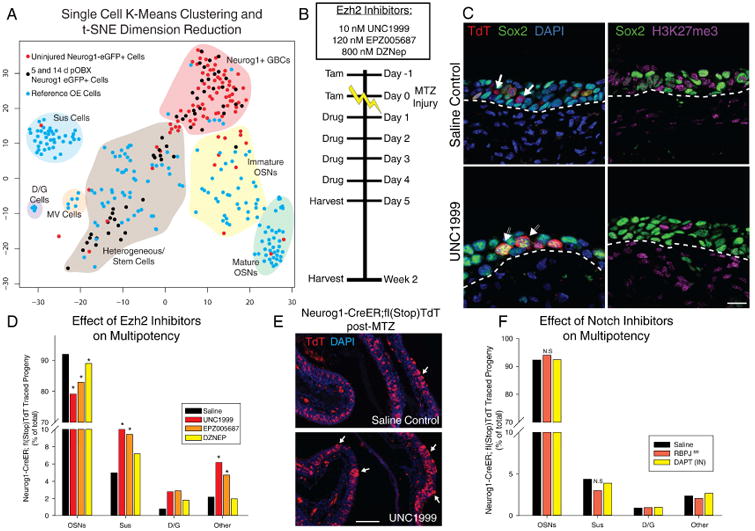
Figure 5. Single Cell Transcriptional Profiling and Validation of Functional Pathways.

(A) t-distributed stochastic neighbor embedding (t-SNE) dimension reduction of single cell transcriptomes. Blue cells were cells sampled from uninjured OE; red cells are Neurog1-eGFP+ FACS isolated cells from uninjured tissue; black cells are isolated from 5 and 14 dpOBX tissue. Shaded areas and labels represent generalized, manually-identified cell groups. (B) Experimental paradigm of dosing with interventional small molecules. (C) IHC of H3K27me3 and Sox2 with vehicle or Ezh2 inhibitor UNC1999, 5 days after methimazole (MTZ) injury. The scale bar equals 10 μm. (D) Quantification of the effect of Ezh2 inhibition on progeny after injury using three inhibitors with different potencies plotted as a total percentage of cell types across replicates (n = 3). (E) Low mag image of saline treated vs. UNC1999 treated Neurog1 lineage trace. Arrows mark locations of assumed multipotency yielding Sus cells. The scale bar equals 100 μm (F) Quantification of Notch inhibition using DAPT or RBPJ genetic knockout depicted as in (D) (n = 3). * p < 0.05, Kruskal-Wallis ANOVA on Ranks. See also Figure S5
