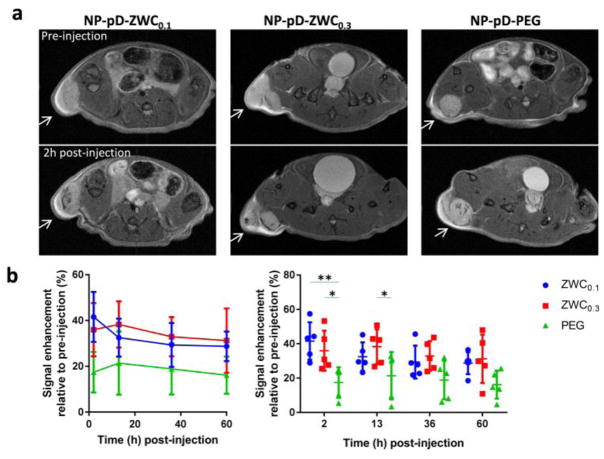
Fig. 5.
(a) Representative T2-weighted MR images of LS174T tumors before and after the treatment with surface-modified IO@NPs. Arrows indicate LS174T tumors. See Supporting Fig. 6 for all five animals per treatment. (b) Signal enhancement at tumor site after injection of IO@NPs in two different representations (n=5 mice per treatment; average ± standard deviation). Two graphs are different representations of the same data set: (left) time profile of signal change; (right) comparison among NP types at each time point. *: p<0.05; **: p<0.01 by Tukey’s multiple comparisons test.

