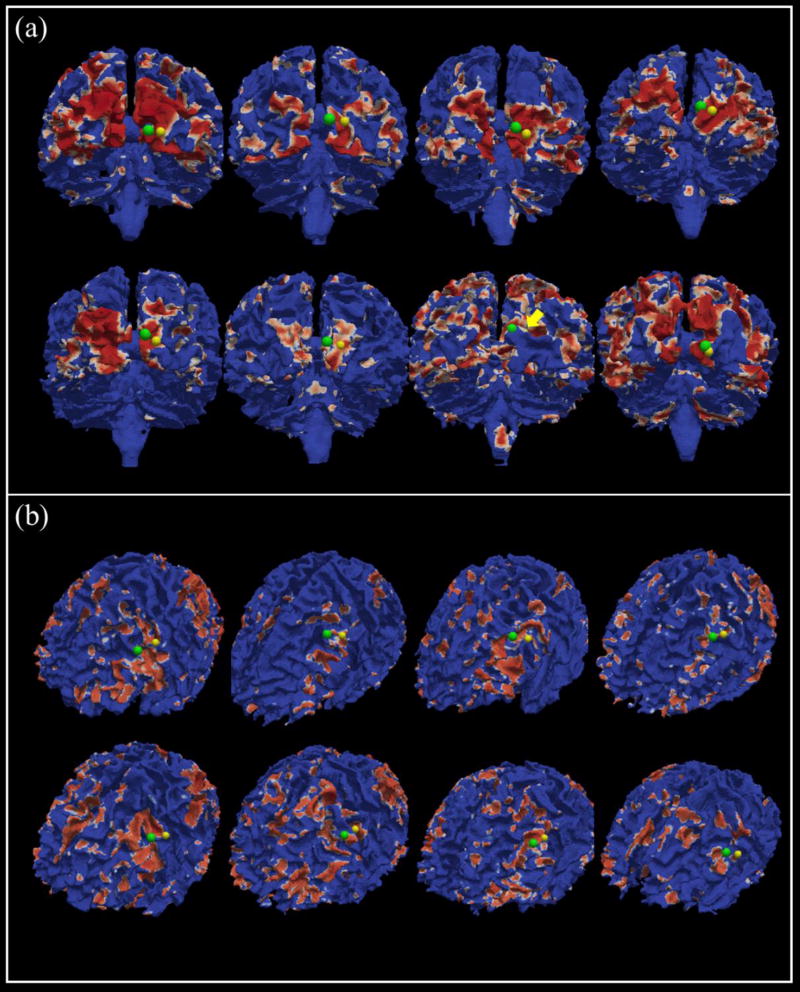
Fig 9.
The locations of the landmarks before and after optimization. (a) and (b) are the two examples. In each example, 8 function networks are picked up from 8 different subjects, which are corresponding to the same group-level common functional network. Yellow dots are the landmarks before the optimization, and green dots are the optimized landmarks. Red areas represent the highly activated patterns on the cortical surface. The yellow arrow (in panel (a)) is used to show the location of a landmark before the optimization as it is blocked by the gyrus. (a) is corresponding to G2 network in Fig.3, and (b) is corresponding to W3 network in Fig.3.

