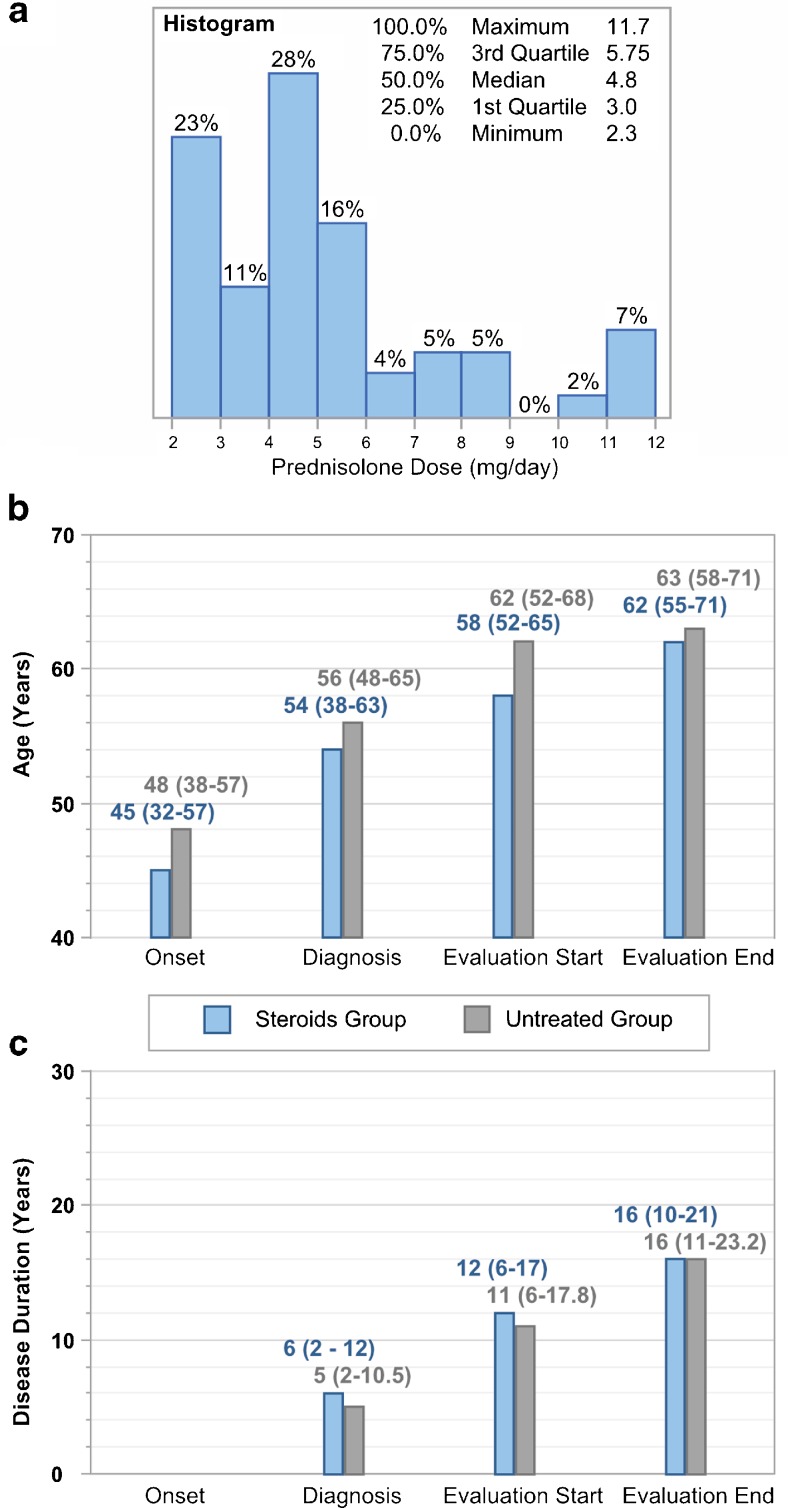
Fig. 1.
Prednisolone (PSL) dose, age, and disease duration of study participants. (A) Distribution of the average daily dose of PSL in all treated patients (n = 57). (B, C) Median (and interquartile range) (B) age and (C) disease duration of patients in the “Steroids” group (blue, n = 57) and “Untreated” group (gray, n = 29) at the onset of human T-lymphotropic virus type 1 (HAM)/tropical spastic paraparesis (TSP), diagnosis of HAM/TSP, and the beginning and end of the period of evaluation (listed from left to right in chronological order). There were no significant differences in age or disease duration between the patients in the Steroids and Untreated groups (Wilcoxon/Kruskal–Wallis 2-sample test, normal approximation)

