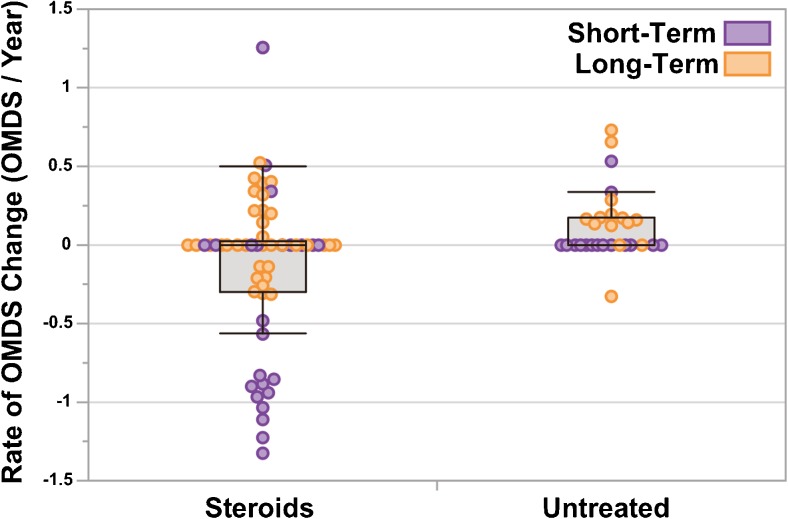
Fig. 4.
Rate of change in motor disability for patients in the “Steroids” vs “Untreated” groups. Box-and-whisker plots showing the rate of change in Osame Motor Disability Score (OMDS) over time (ΔOMDS/year) for patients in the Steroids (n = 57) and Untreated (n = 29) groups. Each point represents a single patient. Points are colored purple for patients evaluated over the Long-term (> 3 years) and orange for the Short-term (< 3 years). The rate of change in OMDS was calculated for each patient using the quotient: total change in OMDS over the period of evaluation/the duration of the period of evaluation in years. The distributions for the Steroid and Untreated groups shown were significantly different (p < 0.01), as determined using the Wilcoxon/Kruskal–Wallis test (normal approximation). Points are jittered for ease of viewing. In the box-and-whisker plots, the boxes extend from the lower quartile to upper quartile and are segmented by a line representing the median, which in this case is at 0 for both groups. The whiskers extend to the maximum and minimum values, excluding outliers (more than 3/2 times the value of the upper quartile or less than 3/2 the value of the lower quartile)

