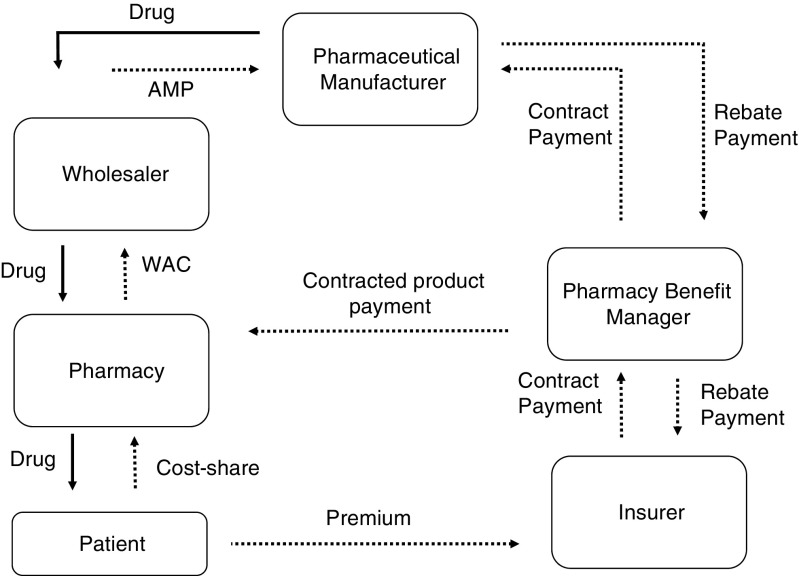
Fig. 1.
Schematic of the flow of money and drug product in the drug distribution system. Sold lines represent drug product movement. Dashed lines represent payments. Figure adapted from Academy of Managed Care Pharmacy Guide to Pharmaceutical Payment Methods (2013 Update).
AMP = Average Manufacturer Price; WAC = Wholesale Acquisition Cost

