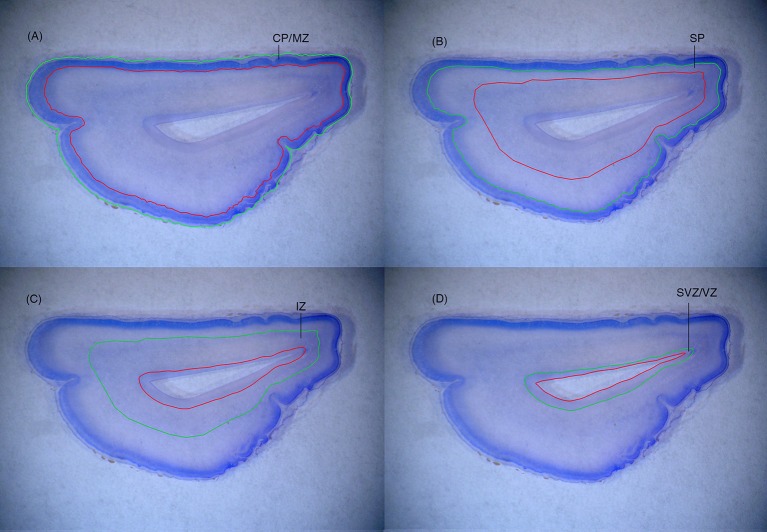
Figure 2.
(A) The inclusion line (green line) for the CP/MZ is drawn according to the outer pial surface, whereas the exclusion line (red line) for the CP/MZ is made at the interface between the CP/MZ and the SP. (B) After the cells in the CP/MZ are counted within optical disectors for this zone, the former exclusion line of the CP/MZ becomes the inclusion line for the underlying SP and a new exclusion line is drawn at the interface between the SP and the IZ. (C,D) The same procedure is applied to the IZ and the SVZ/VZ, thus ensuring that no areas (and thus no cells) are omitted or counted twice due to inconsistent delineation.

