Fig. 1.
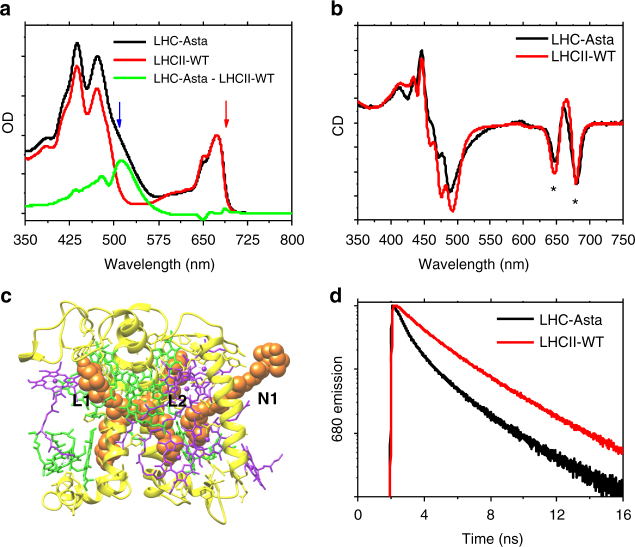
Spectral characterization of LHC–Asta and comparison with LHCII-WT. a Steady-state absorption spectra (normalized to the Chl content, assumed to be the same in LHC–Asta and LHCII-WT). The difference absorption spectrum (LHC–Asta minus LHCII-WT; green curve) shows features of astaxanthin in solution35 minus the Cars missing in LHCII-Asta (lutein, neoxanthin, and violaxanthin)67. The blue and the red arrows indicates the two excitation wavelengths used for the transient absorption experiments (respectively, 508 and 690 nm). b Circular dichroism (normalized to the OD) of LHC–Asta and LHCII-WT monomers. The asterisks indicate the conserved Chl excitonic bands. c A model of the protein and pigment organization of this complex based on the estimated pigment stoichiometry (about 14 Chls and three Cars per monomer, see text). In the model the protein is depicted in yellow, the Chls a and b in green and purple, respectively, and the astaxanthin molecules in orange. Native Car-binding sites in monomeric LHCs are also indicated (L1, L2, N1). d Fluorescence decay kinetics (normalized to peak value) detected at 680 nm after excitation at 470 nm, y-axis in logarithmic scale

