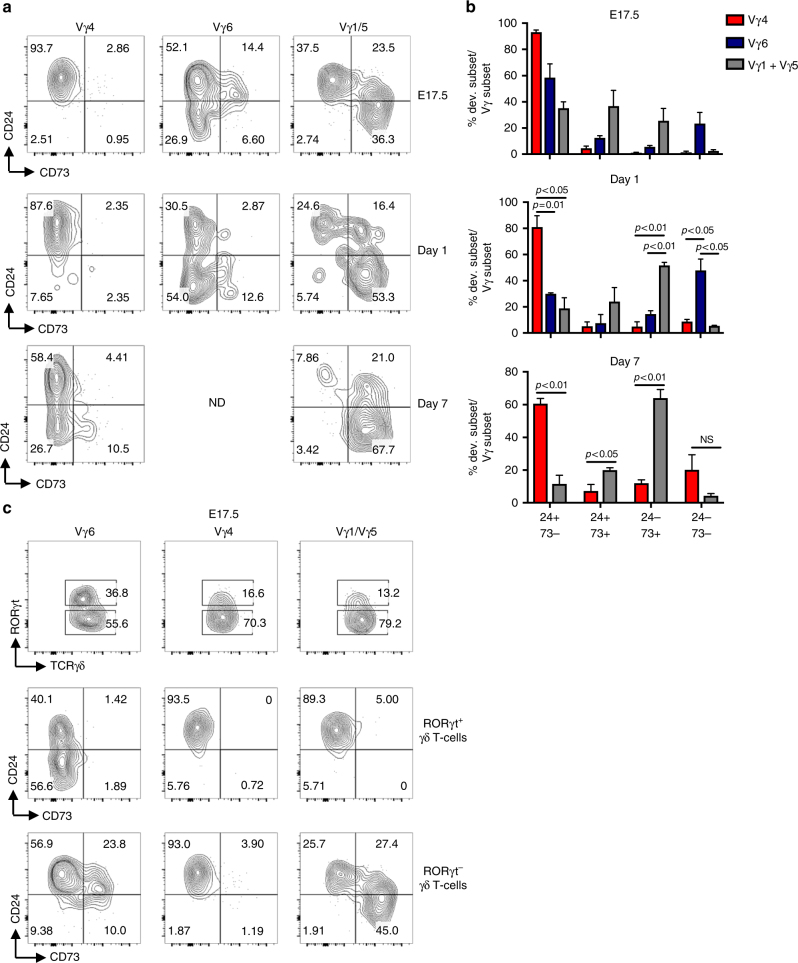
Fig. 3.
Developmental profiles of Vγ subsets. a Representative FACS plots of CD24/CD73 profiles of Vγ4, Vγ6, and Vγ1/5 cells in WT ex vivo thymus from mice aged E17.5, 1 day, and 7 days. b Proportions of C24/CD73 developmental subsets in each Vγ population (Vγ4, Vγ6, and Vγ1/5). For E17.5, all comparisons between each subset between Vγ populations are statistically significant with p < 0.05, except for the comparison of proportions of CD24−CD73− cells within Vγ4 vs Vγ1/5. For day 1, comparisons are not statistically significant unless otherwise indicated. c RORγt+ and RORγt− populations within Vγ subsets, and CD24/CD73 developmental profiles of RORγt+ and RORγt− Vγ subsets. All plots are gated on CD3+TCRγδ+ cells. Numbers in FACS plots indicate frequency within each gate. Data are representative of at least three independent mice. Center values indicate mean, error bars denote s.e.m. p-values were determined by two tailed Student's t-test. ND = not done due to low cell number, NS = not significant

