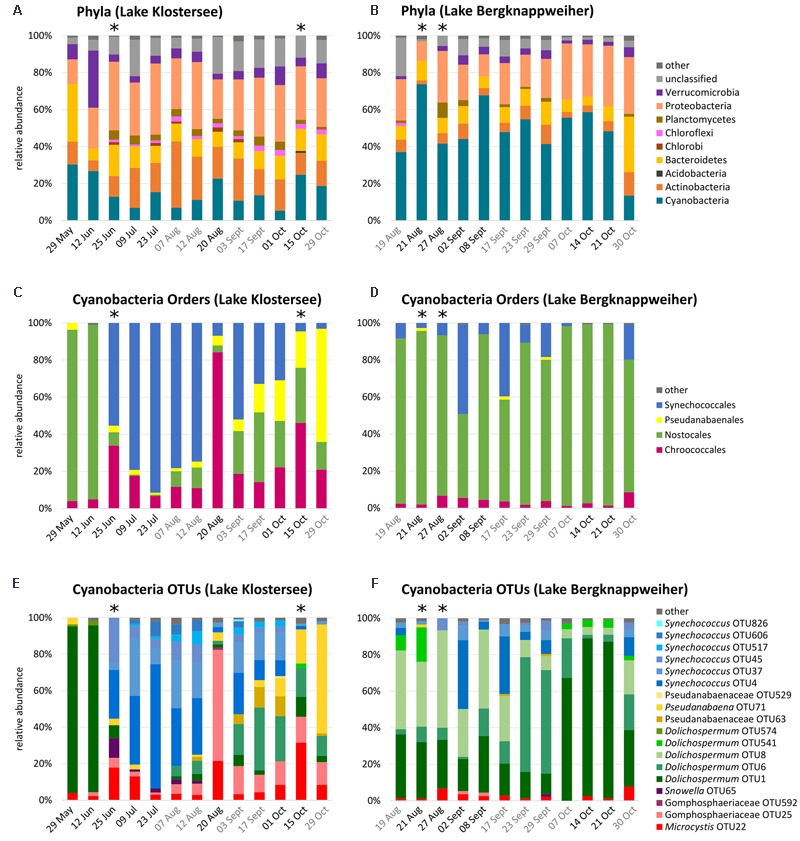
FIGURE 2.

Bacterioplankton community composition in Lake Klostersee (left) and Lake Bergknappweiher (right) (relative abundances < 1% shown as “other”). Dates in black indicate VSBs. Dates in grey indicate the absence of VSBs. Asterisks indicate < 1,000 sequences. Note different intervals on x-axis. (A,B) Percent relative abundances of bacterial taxa at the phylum level. (C,D) Percent relative abundances of cyanobacterial taxa at the order level. (E,F) Percent relative abundances of cyanobacterial taxa at the level of OTUs (97% sequence identity).
