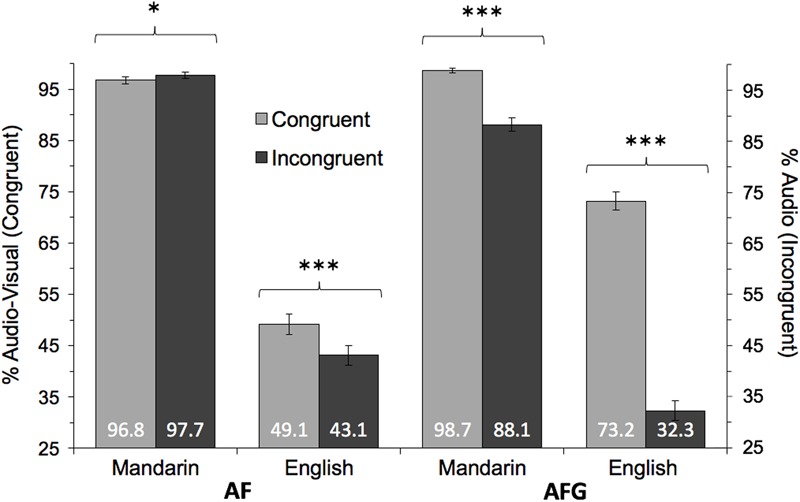
FIGURE 2.

Mean accuracy comparisons between Congruent and Incongruent conditions for each Group (Mandarin, English) and Modality (AF, AFG). Congruent accuracy measured as % responses aligned with audio-visual tone; Incongruent accuracy measured as % responses aligned with auditory tone. Statistically significant Congruency effects indicated at ∗p < 0.05, ∗∗p < 0.01, ∗∗∗p < 0.001. Error bars indicate 95% confidence interval.
