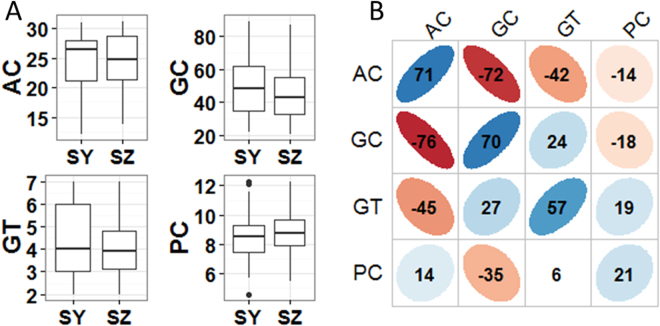
Figure 2.
(A) Box plots of four investigated traits in two environments. SY: Sanya. SZ: Shenzhen. AC: Apparent Amylose Content. GC: Gel Consistency. GT: Gelatinization Temperature. PC: Protein Content (B) Correlations between four evaluated traits in SY (upper triangular) and SZ (lower triangular). The values were correlation coefficients (r) multiplied by 100. The values on principal diagonal indicated correlations between SY and SZ. The areas and colors of ellipses showed the absolute value of corresponding r. Right and left oblique ellipses indicated positive and negative correlations, respectively. The values without glyphs indicated insignificant at 0.05.

