
Fig. 4.
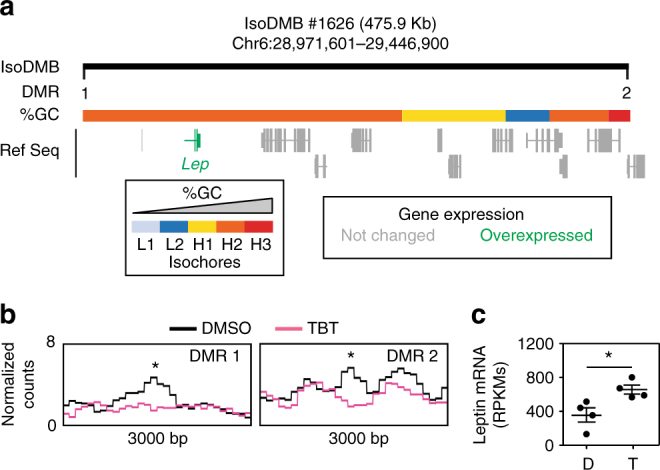
Ancestral TBT exposure leads to altered DNA methylation and expression of the leptin gene. a Upper panel represents isoDMB #1626 (black bar), and its overlap with regions with different GC content. DMRs punctuating this hypomethylated isoDMB are represented with black vertical bars and numbered (1–2). Overexpressed genes within the isoDMB (Lep, leptin) are represented in green and genes whose expression does not change between DMSO and TBT are represented in gray. b Bottom panels show the variation for the mean (n = 4) of MBD-seq read coverage for TBT and DMSO samples within 3000 bp regions with the 100 bp DMRs indicated with an asterisk. c RPKMs from RNA-seq analysis of leptin mRNA expression (n = 4). D, DMSO; T, TBT. Statistical significance was determined using R (version 3.3), and Bioconductor (version 3.3) package edgeR (version 3.14)54. Data are presented as mean ± s.e.m. *p < 0.05