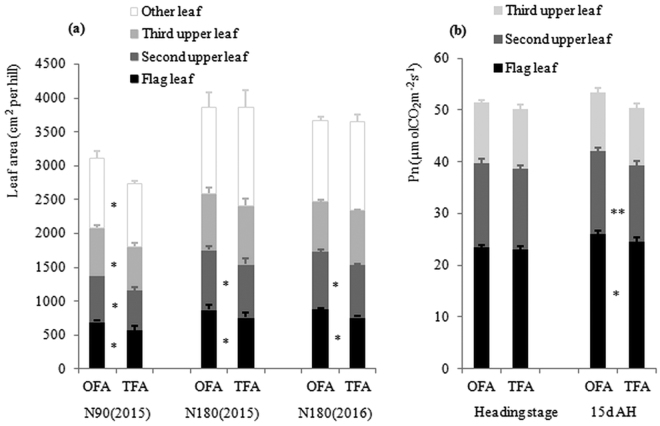
Figure 6.
Changes in photosynthetic area and net photosynthetic rate (Pn) in response to different nitrogen applications. (a) leaf area; (b) net photosynthetic rate. OFA: optimized nitrogen fertilizer application; TFA: traditional nitrogen fertilizer application; N90: total nitrogen application rate of 90 kg ha−1; N180: total N application rate of 180 kg ha−1; AH: after heading stage; Pn: net photosynthetic rate; * and ** indicate significant difference of the two nitrogen treatments at 0.05 and 0.01 probability levels, respectively.

