
Figure 2.
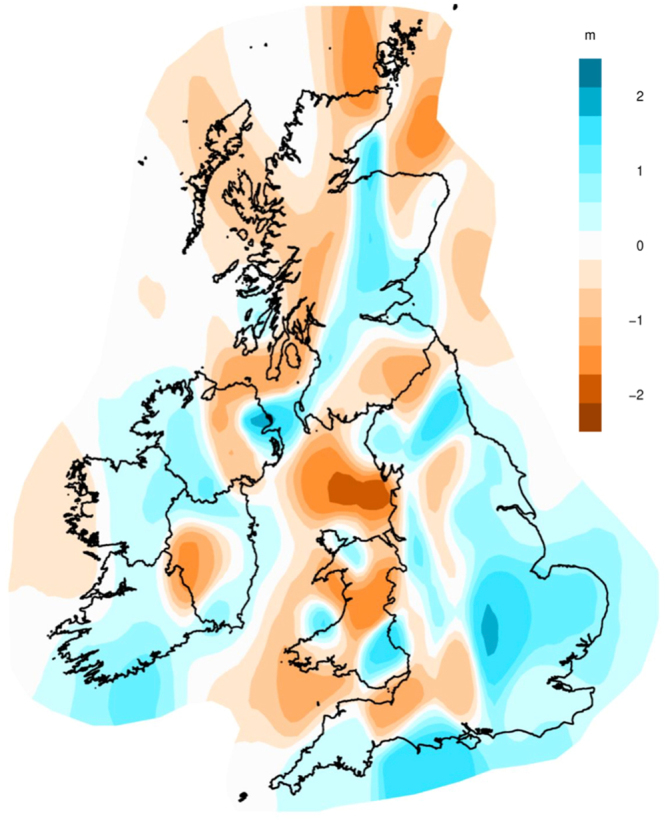
The estimated effective migration surface of Ireland and Britain from 1803 Irish and British individuals. Shown are the posterior mean migration rates of the six independent EEMS chains (m – on a log10 scale). The outline of Britain was sourced from Global Administrative Areas (2012). GADM database of Global Administrative Areas, version 2.0. www.gadm.org. The outline of Ireland was Open Street Map Ireland, Copyright OpenStreetMap Contributors, (https://www.openstreetmap.ie/) - data available under the Open Database Licence. The figure was produced in the statistical software language R46, version 3.4.1, with the package rEEMSplots.