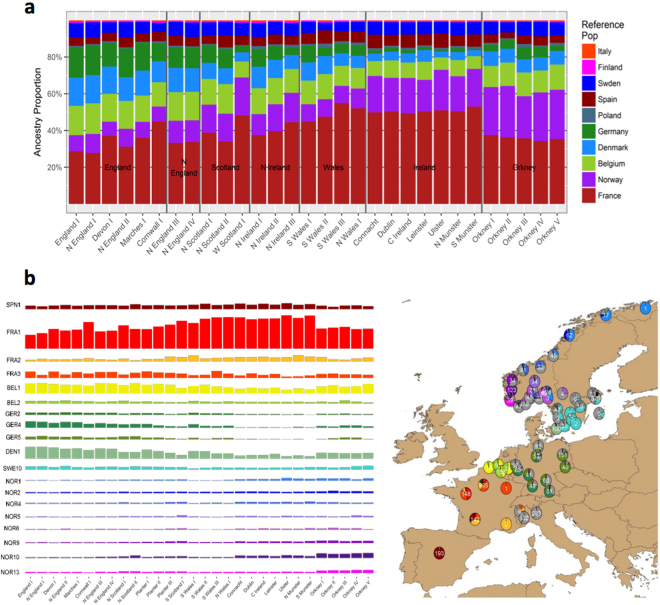
Figure 3.
The European ancestry profiles of 30 Irish and British clusters. (a) The total ancestry contribution summarised by majority European country of origin to each of the 30 Irish and British clusters. (b) (left) The ancestry contributions of 19 European clusters that donate at least 2.5% ancestry to any one Irish or British cluster. (right) The geographic distribution of the 19 European clusters, shown as the proportion of individuals in each European region belonging to each of the 19 European clusters. The proportion of individuals form each European region not a member of the 19 European clusters is shown in grey. Total numbers of individuals from each region are shown in white text. Not all Europeans included in the analysis were phenotyped geographically. The figure was generated in the statistical software language R46, version 3.4.1, using various packages. The map of Europe was sourced from the R software package “mapdata” (https://CRAN.R-project.org/package=mapdata).

