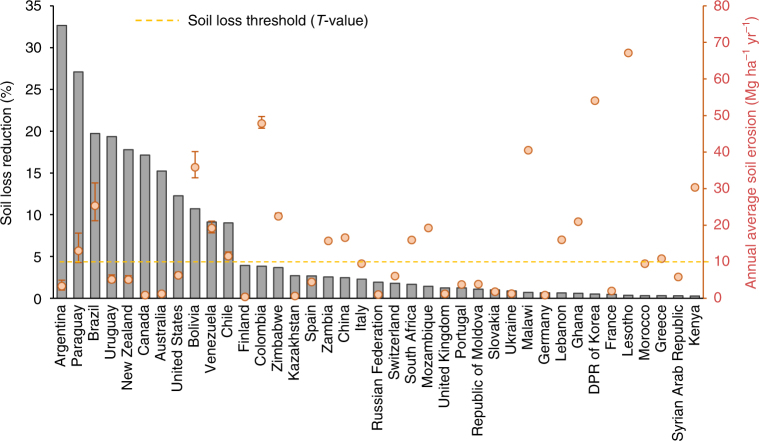
Fig. 4.
Estimated soil loss reduced by conservation agriculture. The grey bars illustrate the estimated soil loss reduction (in percent) derived from the implementation of conservation agriculture (40 countries show the highest reduction values). The values refer to the model application for the year 2012 adjusted for the potential effect of conservation agriculture practices. Red dots indicate the national average of annual soil loss estimated in cropland (Mg ha−1 yr−1). The red error bars around the dots indicate the variation between the mean values of the conservation scenario, the baseline scenario (positive bar) and the maximum mitigation effect of the practices (negative bar). The dotted orange line shows the soil loss tolerance threshold (T value—10 Mg ha−1 yr−1)

