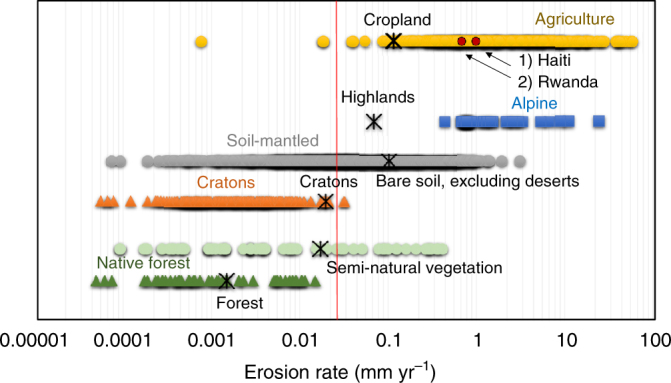
Fig. 6.

Comparison of measured and modelled erosion rates. Representation of soil erosion rates measured on agricultural fields under conventional agriculture (n = 779), geologic erosion rates measured on alpine terrain (n = 44), soil-mantled landscapes (n = 1456), low gradient continental cratons (n = 218), grassland and scrublands (n = 63), native forests (n = 46) and averages of our predictions (indicated by an asterisk). Large parts of the measured data come from the study of Montgomery8 integrated with data from other meta-analysis studies. The vertical red line indicates average value of soil erosion. The red dots refer to averages soil erosion rates modelled for two country highly susceptible to water erosion (Haiti and Rwanda)
