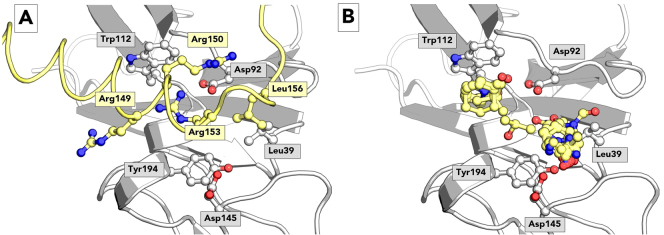
Figure 2.
Hotspot analysis of human TSLPR. Panel A shows the TSLP:TSLPR interface as observed in the TSLP:TSLPR: IL-7Rα crystal structure. TSLP is shown in yellow cartoon representation, TSLPR in grey. Selected protein residues are shown in ball-and-stick, among which hotspot residues Arg149, Arg150 and Arg153 as identified by PredHS. Panel B shows FTMap probes in yellow ball-and-stick representation on the TSLPR surface. The two clusters are composed of the probes isobutanol, cyclohexane, dimethyl ether, ethanol, phenol, isopropanol, acetonitrile, methylamine, N,N-dimethylformamide, acetaldehyde, acetamide, ethane, acetone, urea and benzene.

