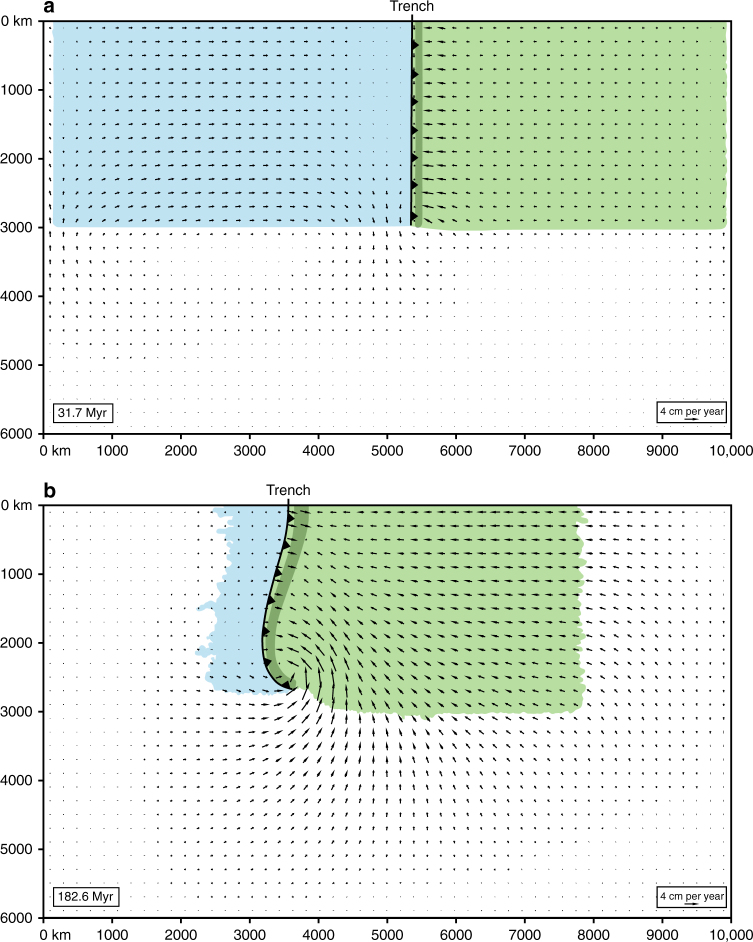
Fig. 4.
Model results showing the horizontal velocity field in the mantle at 200 km depth and the outlines of the tectonic plates at the surface. a At 31.7 Myr. b At 182.6 Myr. Also shown are the trench (black continuous line with black triangles) and the outline of the slab at 200 km depth (elongated dark green feature on the right-hand side of the trench running sub-parallel to the trench). Note that the subducting plate is in blue, while the overriding plate is in green

