Fig. 6.
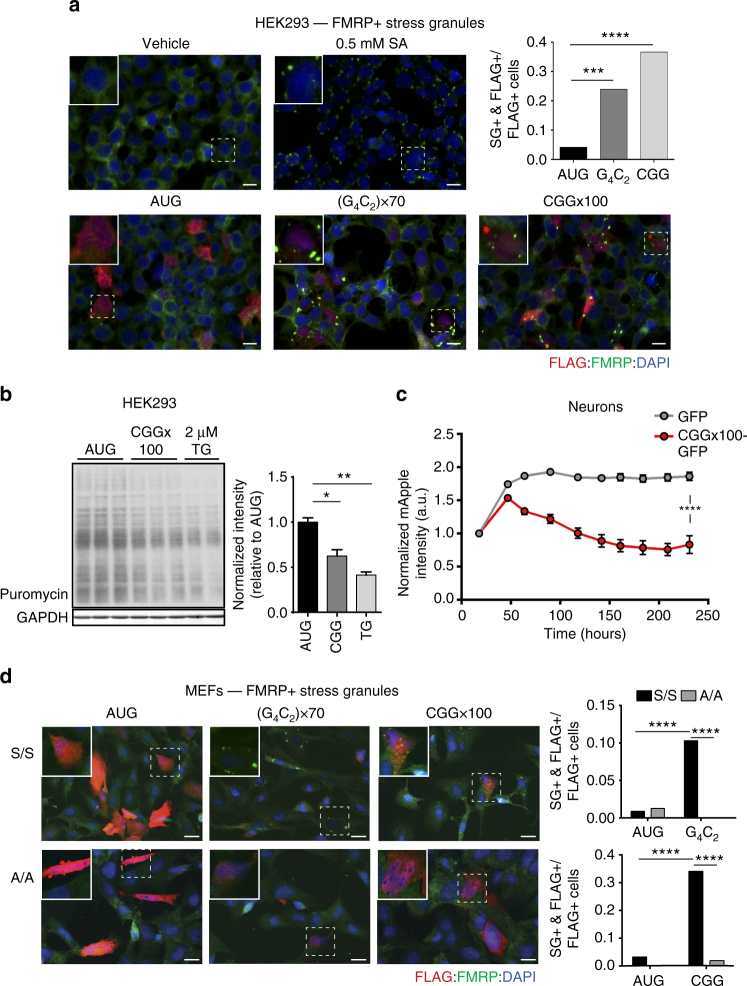
CGG and G4C2 repeat expansions induce phosphorylated-eIF2α-dependent stress granules. a Top left: immunofluorescent images of HEK239 cells treated with vehicle or 0.5M SA. Bottom: immunofluorescent images of HEK239 cells expressing control, (G4C2)×70, or CGG×100 reporters, scale bar = 100 µm. Top right: quantification of the proportion of FLAG-positive cells with FMRP-positive stress granules (SGs) for each genotype, n > 70. b Western blot and quantification of puromycin incorporation in cells transfected with control AUG-NLuc or CGG×100 reporter, or treated with 2 µM TG as a positive control. GAPDH is used as a loading control. Graph represents mean ± SEM. c mApple fluorescent intensity in primary rat cortical neurons co-transfected with GFP or CGG×100-GFP, longitudinally imaged with automated fluorescent microscopy for 10 days following transfection, n > 68. Graph represents mean ± 95% confidence interval. d Left: immunofluorescent images of WT eIF2α- S51 S/S and eIF2α- S51 A/A MEFs expressing control, (G4C2)×70, or CGG×100 reporters, scale bar = 100 µm. Right: quantification of the proportion of FLAG-positive cells with FMRP-positive SGs for each genotype, n > 40. FLAG marks reporter expressing cells, FMRP mark SGs. For a and d, Fisher’s exact test, ∗∗∗ p < 0.001; ∗∗∗∗ p < 0.0001. For b and c, two-tailed Student’s t test with Bonferroni and Welch’s correction, ∗ p < 0.05; ∗∗ p < 0.01; ∗∗∗∗ p < 0.0001

