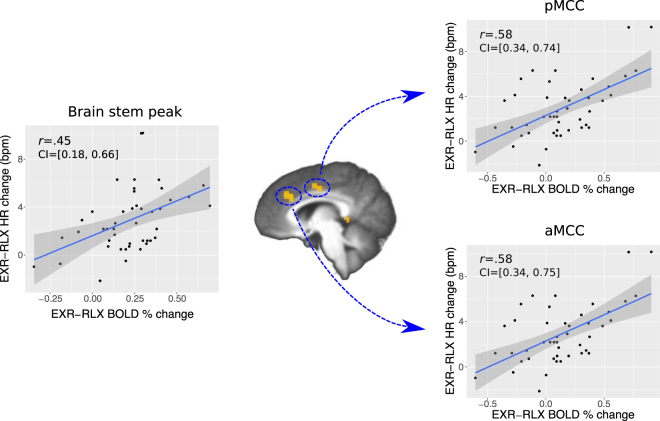
Figure 8.
Relationship between individual EXR-RLX changes in heart rate (HR) and in the BOLD response to the effort cue. On the left side, the HR changes are regressed onto the BOLD average contrast of parameter estimates in a 3mm-radius sphere centered on the global activation peak from the cueEXR-cueRLX contrast (Talairach coordinates: 8, −22, −8). On the right side, similar graphs are displayed for the anterior and posterior midcingulate clusters (aMCC, pMCC) from the whole-brain analysis. Pearson’s correlation coefficients (r) and 95% confidence intervals (CI) are indicated in the plots.

