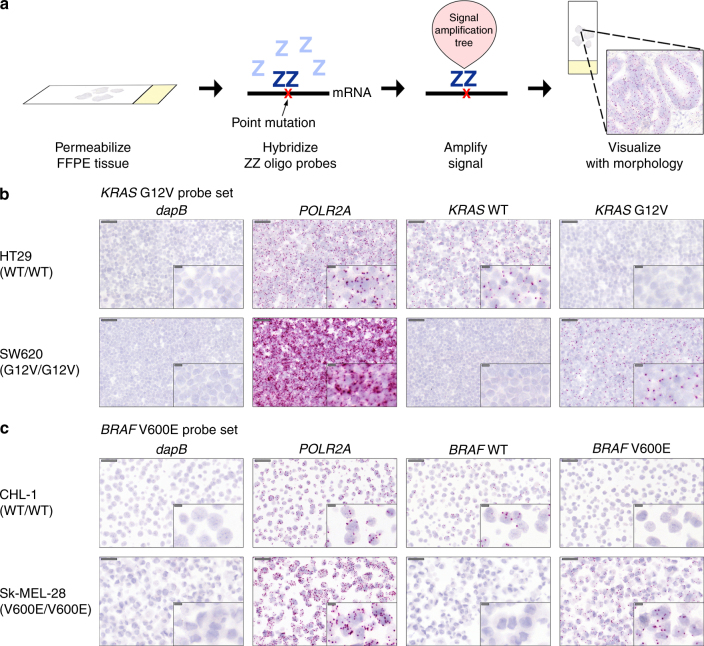
Fig. 1.
Validation of BaseScope probes in cell lines. a Schematic of BaseScope technology. Binding of two custom-designed ‘Z’ probes to target mRNA directs binding of a signal amplification tree, allowing visualization of point mutations by FastRed. b, c Representative images of the validation of the KRAS G12V probeset b and BRAF V600E probeset c In both cases a wild-type cell line and a homozygous mutant cell line are shown, with a negative control probe (dapB), a positive control probe (POLR2A), the wild-type probe and the mutant probe. Probe binding is visualized as punctate red dots. Scale bars represent 50 micron and 10 micron (inset)

