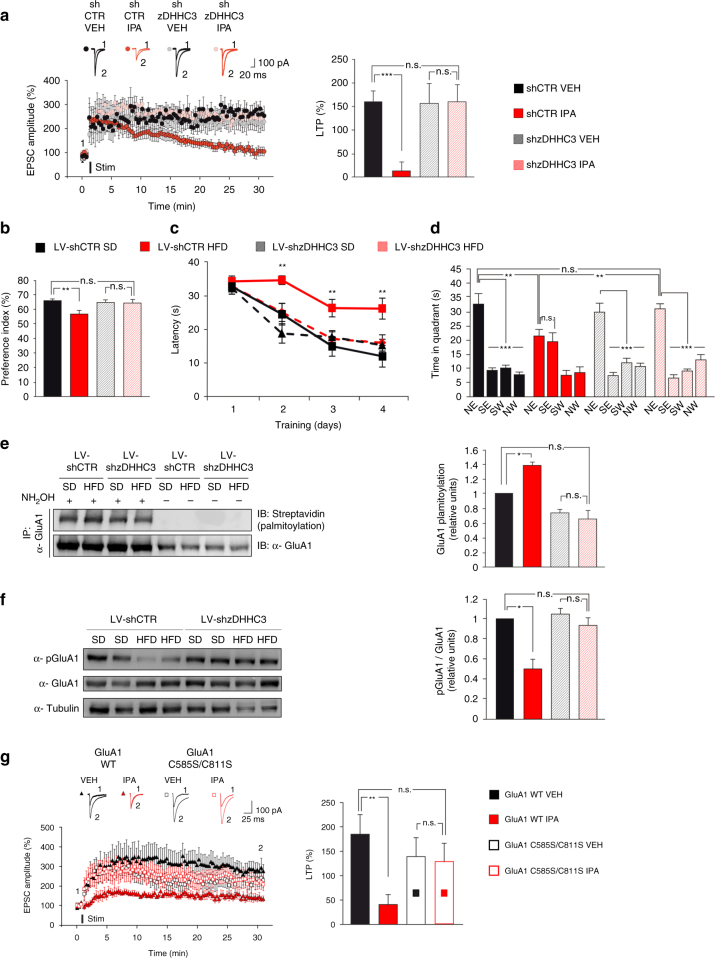
Fig. 5.
Hippocampal silencing of zDHHC3 abolishes HFD-dependent learning and memory impairment. a Time course (left) of LTP at CA3-CA1 synapses in hippocampal organotypic slices transfected with plasmid-encoding for control shRNA or zDHHC3 shRNA and treated with vehicle (VEH) or IPA for 24 h. Results are expressed as percentages of baseline EPSC amplitude (=100%). Insets (top) show representative EPSC at baseline (1) and during the last 5 min of LTP recording (2). On right, mean LTP values during the last 5 min (n = 7 for each group; statistics by two-way ANOVA and Bonferroni post hoc). b Preference for the novel object of mice fed SD or HFD and injected with lentiviral particles harboring control shRNA (LV-shCTR) or shRNA against zDHHC3 (LV-shzDHHC3) (n = 9 for each group; statistics by two-way ANOVA and Bonferroni post hoc). c Latency to reach the platform (n = 9 for each group; significance is indicated for LV-shCTRHFD vs. all other groups; statistics by two-way ANOVA and Bonferroni post hoc). d Time spent in the four quadrants during probe test. NE is the target quadrant (n = 9 for each group; statistics by two-way ANOVA and Bonferroni post hoc). e Palmitoylated GluA1 (left, top) and total immunoprecipitated protein (left, bottom) in hippocampi. Densitometry (right) of palmitoylated GluA1/total immunoprecipitated GluA1 ratio (n = 3 per each group; statistics by two-way ANOVA and Bonferroni post hoc). f Immunoblots of pGluA1 Ser845 and densitometry of pGluA1 Ser845 normalized to both the total GluA1 and tubulin (n = 5 mice per group; statistics by two-way ANOVA and Bonferroni post hoc). g Time course (left) of LTP at CA3-CA1 synapses in hippocampal organotypic slices transfected with plasmids encoding for GluA1 WT or GluA1 C585S/C811S. Results are expressed as percentages of baseline EPSC amplitude (=100%). Insets (top) show representative EPSC at baseline (1) and during the last 5 min of LTP recording (2). On right, mean LTP values during the last 5 min (n = 12 for each group; statistics by two-way ANOVA and Bonferroni post hoc). Data are expressed as mean ± SEM *p < 0.05; **p < 0.01; ***p < 0.001; n.s. not significant. See also Supplementary Fig. 4

