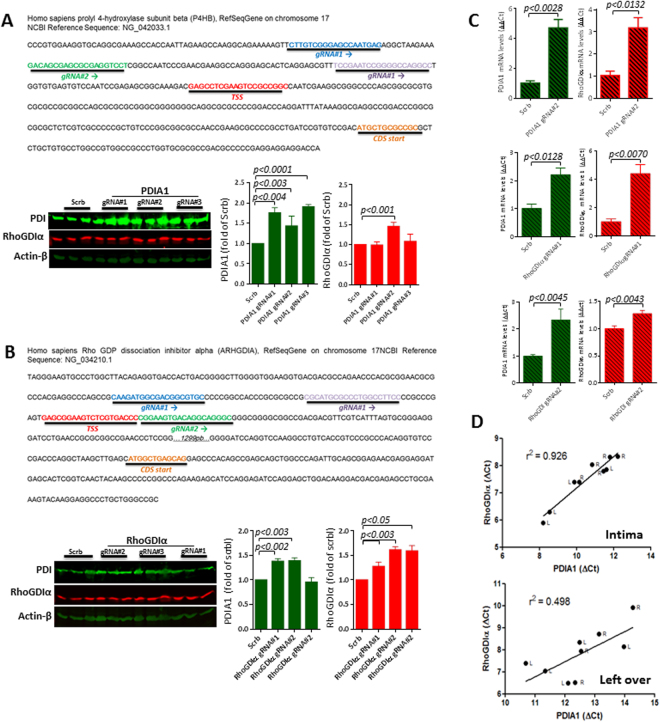
Figure 7.
Investigation of PDIA1 and RhoGDIα co-regulation in different systems. (A) Effects of induced PDIA1 transcriptional activation on RhoGDIα protein levels (see methods); three distinct guide RNAs, depicted on the map above, were used to drive CRISPR dCas9 VP64-mediated PDIA1 transcription; (B) Design similar to (A): effects of induced RhoGDIα transcriptional activation on PDIA1 protein levels; three distinct guideRNAs, depicted on the map above, were used to drive CRISPR dCas9 VP64-mediated RhoGDIα transcription. In both cases, data are representative of three sets of independent experiments. Results are mean and SEM. (C) Results of mRNA expression levels from experiments depicted in (A) and (D). Representative from 3 independent set of experiments; results are mean and SEM. Uncropped western blots are shown in Supplementary Fig. S8. (D) Correlation coefficient (r2) between mRNA expressions of PDIA1 vs. RhoGDIα from left carotid arteries (L) 48 h after partial carotid ligation and their contralateral right carotid arteries (R). Left graph depicts intimal samples and right graph depicts left over tissue (media + adventitia). Data represent Delta Ct (gene target - 18 S). Each dot represents an individual artery from n = 4–5 mice.

