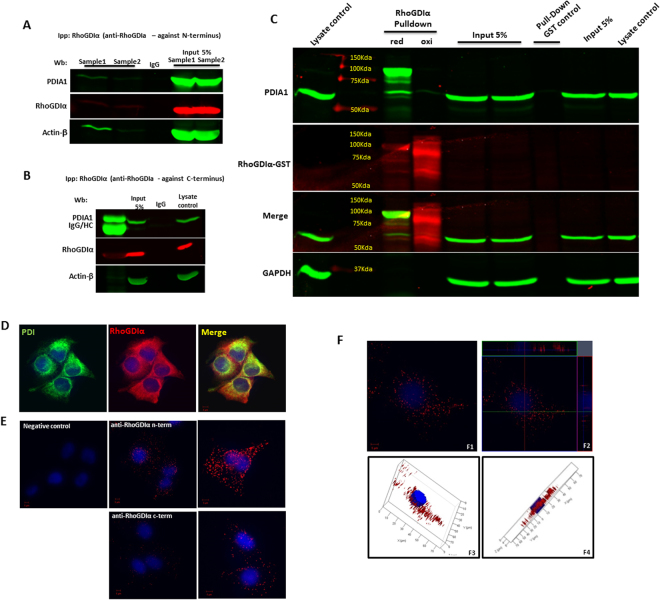
Figure 8.
Physical interaction between PDIA1 and RhoGDIα in endothelial cells. (A) and (B) RhoGDIα immunoprecipitation followed by Western blot for PDIA1. RhoGDIα was immunoprecipitated using IgG against N-terminus (A) or C-terminus (B). (C) PDI and RhoGDIα interaction by pulldown assay. Using RhoGDIα-GST which was either reduced (DTT 20 mM) or oxidized (H2O2 20 mM), we pulled down PDI from HUVEC lysates under reduced conditions. Reduced RhoGDIα was able to pull-down PDIA1 as a monomer and as an apparent heterodimer, while oxidized RhoGDIα incubation resulted in the appearance of its dimeric form. Results representative from 3 experiments. (D) Confocal microscopy images for PDIA1 and RhoGDIα showing co-localization. Representative results of three experiments which were replicated using 2 different antibodies to PDIA1 and 2 different antibodies to RhoGDIα (N-terminus and C-terminus). Magnification 40x and zoom 2.5x; Uncropped western blots are shown in Supplementary Fig. S10. (E) Representative confocal images of proximity ligation assay (PLA) analysis showing the interaction between PDI and RhoGDIAα in HUVEC. Positive signal of protein interaction is represented as a red dot; nuclei are stained with DAPI (blue). Cells in panels E1-E4 were incubated with a mix of antibodies against PDIA1 and RhoGDIα. Panel B shows negative control in which the primary antibodies were omitted. Magnification: in E, 40x; in F1/F3, 40x and zoom 2x; in F2/F4, 63x and zoom 2x; (F) Representative ortho-images (F1 and F2) and 3D reconstruction (F3 and F4) of confocal z-stacks of PLA showing PDI/RhoGDIα dimer distribution into HUVEC. The center image of each panel (shown by crossing lines) is the X-Y view, cross section at the green line is X-Z view and cross section at red line is Y-Z view.

