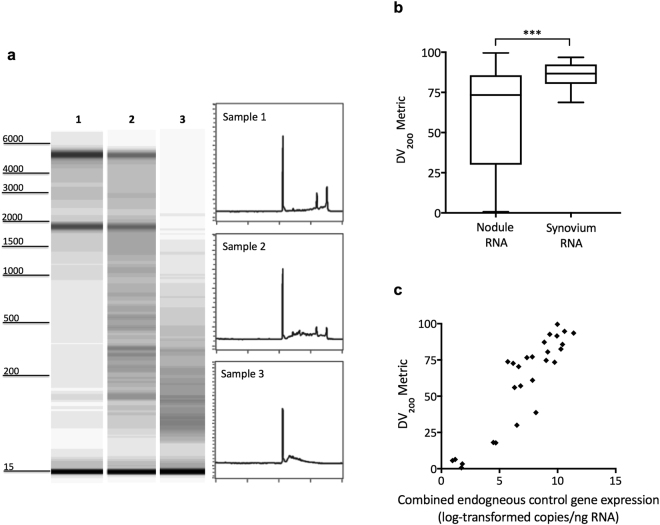
Figure 1.
RNA quality analysis and gene expression. (a) Capillary electrophoresis gel images and electropherograms show the range of RNA quality from representative nodule tissues (1–3). Corresponding DV200 metric values (and accompanying RNA Quality Number, RQN) were: sample 1 = 93.5%, (7.4); sample 2 = 80.5%, (3.3); sample 3 = 38.7%, (1.0). (b) Tukey box and whiskers graph displaying average DV200 metrics for either nodule or synovial membrane RNA samples, which undergo identical sample handling; ***p = 0.0005. (c) Sample DV200 metric values for nodule-derived RNA are positively correlated with the levels of combined endogenous control gene (GAPDH and HPRT1) expression (r = 0.9087; p < 0.0001). Capillary electrophoresis gel images shown in (a) for samples 1–3 are from an original results figure (pdf file), contrast-enhanced to highlight fragmented RNA; Each image was then individually cropped and uniformly resized. Electropherograms shown are black and white versions from an original results figure (pdf file) with no further manipulation. Full versions of these original figures are presented in Supplementary Figures S1 and S2.

