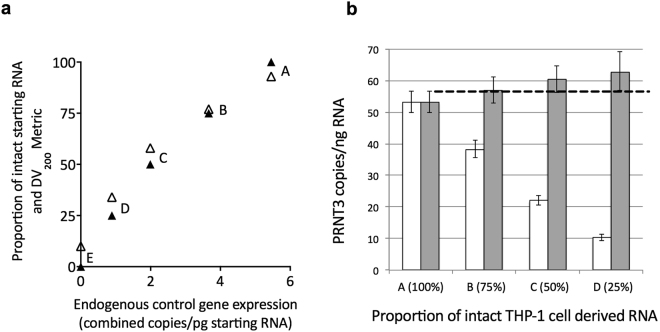
Figure 2.
Influence of fragmented RNA and data normalisation on gene expression. (a) A series of RNA samples (A–E) containing set proportions of intact THP-1 cell RNA, spiked with increasing proportions of highly-fragmented nodule RNA. Corresponding RNA integrity number (RIN) values for the samples were: A: 8.3; B: 8.5; C: 8.1; D: 4.6; E: 2.5. Using dPCR, combined and averaged absolute measures of GAPDH and HPRT1 endogenous control gene expression positively correlate with both the proportion of pre-RT intact RNA (▴; r = 0.9891; p = 0.0014) and the DV200 metrics (Δ; r = 0.9729; p = 0.0053). (b) Absolute (▫) and normalised values ( ) of PRTN3 expression in samples (A–D), with the 95% CI for the copies/pg RNA. The dashed line marks the upper 95% CI limit for sample A. Normalisation was applied according to the calculated endogenous control gene normalisation factors of A: 1; B: 1.49; C: 2.74; D: 6.12; E (not displayed): 3232.

