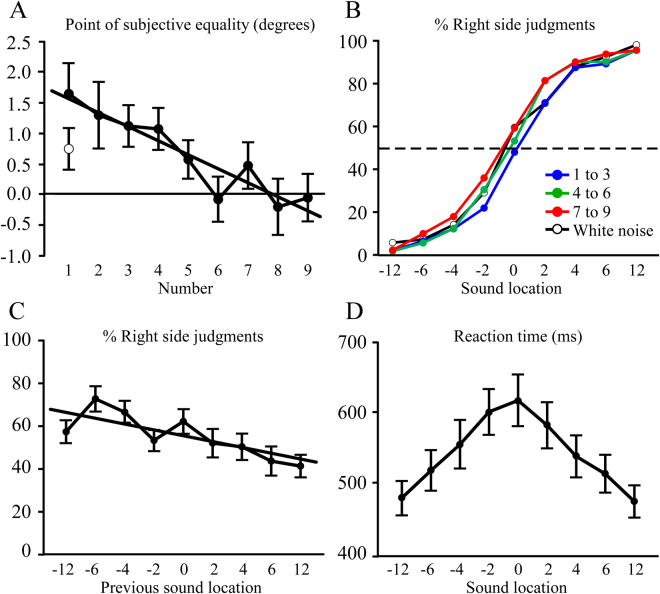
Figure 2.
Experiment 2 results. (A) Point of subjective equality (PSE) plotted as a function of number magnitude. There was a significant negative linear relationship between PSE and number magnitude, indicated by the regression line. A separate control group, indicated by the open circle, performed the same task using a white noise stimulus rather than numbers. The controls had a PSE approximately midway between the numbers 1 and 9. (B) Psychometric functions of “% right” judgments as a function of sound location. For illustration numbers are shown in three groups (1–3, 4–6, 7–9), as well as the white noise control group. The 50% PSE is indicated by a horizontal dotted line. (C) Sequence effects are shown by plotting “percent right” judgments as a function of the location of the previous number. There was a significant effect of sequence as judgments were inversely related to the location of the previous number. (D) Reaction time vs. sound location. There was a significant distance effect, indicated by progressive reductions in reaction time as sound location was farther from the midline.

