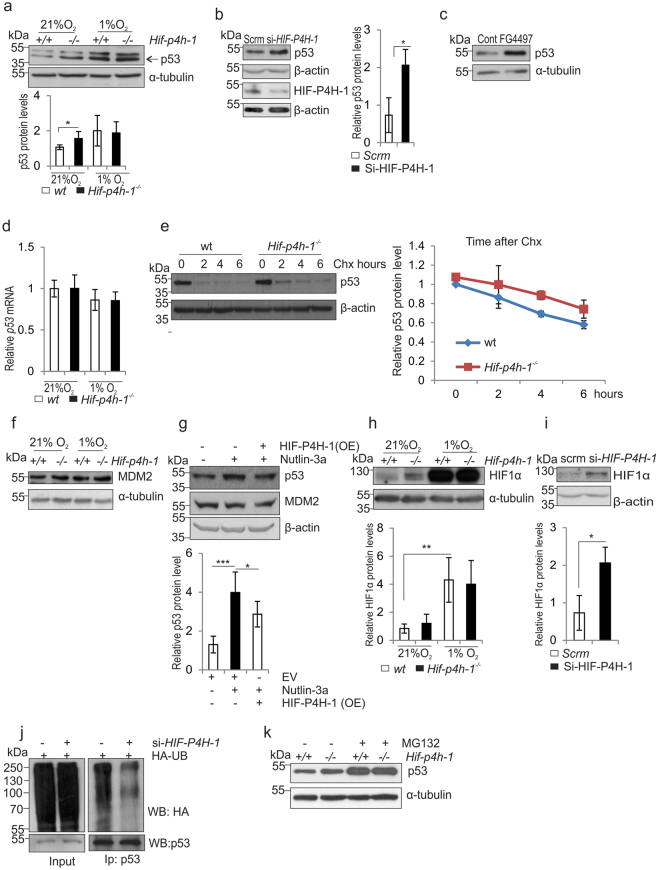
Figure 5.
Lack of HIF-P4H-1 increases the amount of p53. (a) Western blot analysis of p53 in wt and Hif-p4h-1 −/− MEFs cultured in 21% or 1% O2 for 24 h. (b,c) Western blot analysis of p53 in Hif-p4h-1 and scrambled (Scrm) siRNA transfected HEK293 cells (b) and wt MEFs treated with 50 µM FG4497 for 24 h (c). (d) qPCR analysis of p53 mRNA in wt and Hif-p4h-1 −/− MEFs cultured in 21% or 1% O2 for 24 h. (e) Analysis of p53 protein turnover rate. Hif-p4h-1 −/− and wt MEFs were treated with 200 μg/ml of cycloheximide for the indicated time points and whole cell lysates were blotted for p53. (f) Western blot analysis of MDM2 in wt and Hif-p4h-1 −/− MEFs cultured in 21% or 1% O2 for 24 h. (g) Western blot analysis of p53 and MDM2 in wt MEFs treated with 10 μM nutlin-3a for 24 h with or without overexpression of human HIF-P4H-1 (OE). (h,i) Western blot analysis of HIF1α in wt and Hif-p4h-1 −/− MEFs cultured in 21% or 1% O2 for 24 h (h) and in scrambled and Hif-p4h-1 siRNA transfected HEK293 cells (i). (j) Western blot analysis of ubiquitination of p53 in Hif-p4h-1 and scrambled siRNA transfected HEK293 cells. The cells were transfected with HA-ubiquitin and endogenous p53 was immunoprecipitated followed by Western blotting with anti-HA and anti-P53 antibodies. (k) Western blot analysis of p53 in Hif-p4h-1 −/− and wt MEFs were treated with or without 10 μM MG132 for 5 h. Data are presented as representative Western blots and as mean ± s.d., n = at least 3 individual MEF isolates or experiments. *P < 0.05, **P < 0.01 and ***P < 0.001, two-tailed Student’s t-test. Unprocessed original scans of blots are shown in Supplementary Fig. 5.

