
Figure 1.
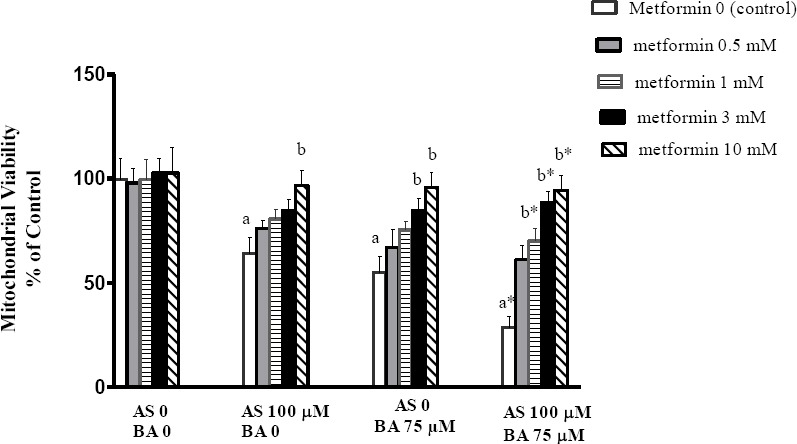
Effects of butyric acid, arsenic and metformin on liver mitochondrial viability (MTT). Data are expressed as the mean ± SEM for 6 mice in each group a: compared to control group (As0, BA0, metformin 0), b: compared to control in each group (metformin 0), a and b P<0.05, a* and b* P<0.01