
Figure 1.
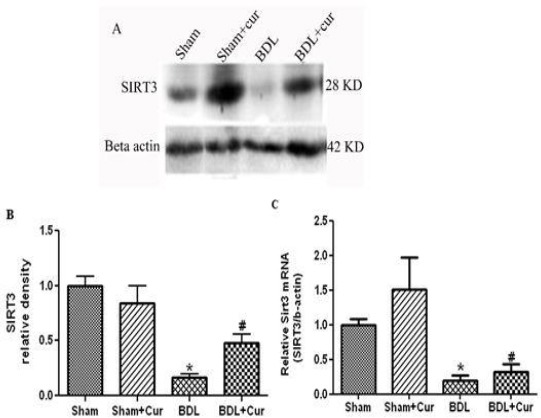
Western blotting pattern of sirtuin3 (Sirt3) proteins expression (Figure 1A), the relative density of protein expression levels of Sirt3 (Figure 1B) and gene expression of SIRT3 (Figure 1C) in four studied groups (Sham, Sham+Cur, BDL, BDL+Cur) analyzed by one-way ANOVA. Significant differences between groups are indicated by symbols (*P-value<0.05 compared with the Sham group and #P-value < 0.05 compared with the bill duct ligation (BDL) group)