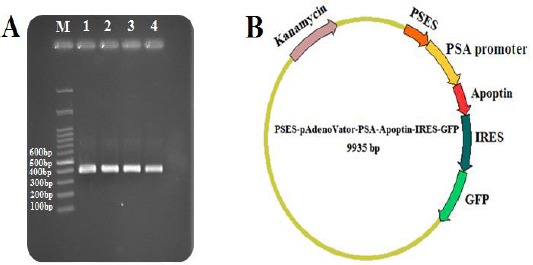
Figure 1.

Construction of the PSES-pAdenoVator-PSA-Apoptin-IRES-GFP plasmid. A: PCR amplification of apoptin gene showed expected size (389 bp) bands on the gel (Lane 1-4), M: Molecular weight markers (100 bp). B: Schematic diagram representing PSES-pAdenoVator-PSA-Apoptin-IRES-GFP plasmid. Apoptin and GFP genes expression were conducted under the control of the PSES/PSA specific regulatory elements
