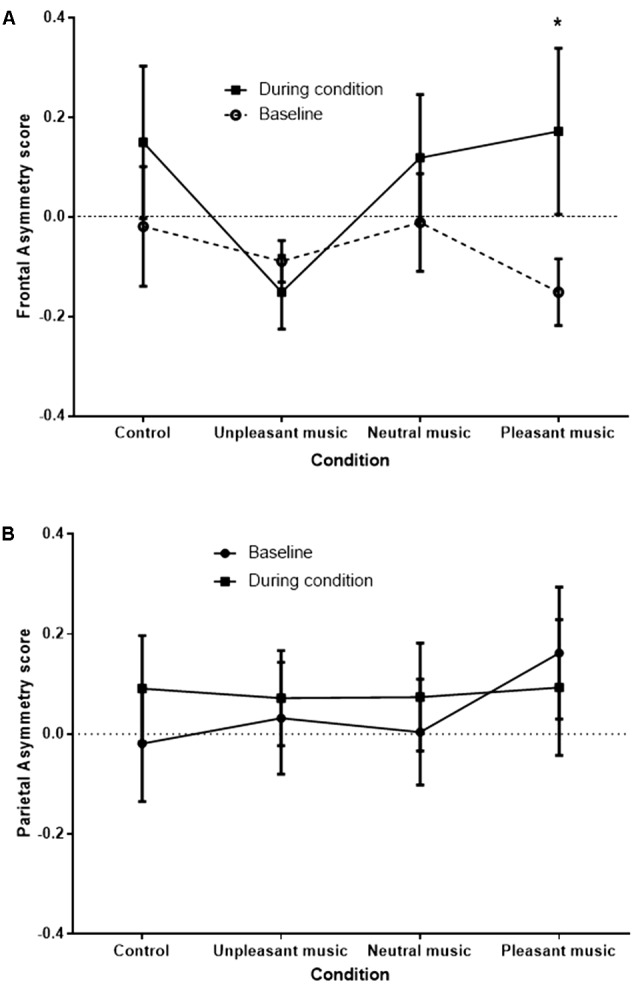
FIGURE 4.

FC3/FC4 (A) and P3/P4 (B) (control) asymmetry score at baseline and during condition, for each condition. Asymmetry scores of 0 indicate no asymmetry. Scores >0 indicate left bias asymmetry (and positive affect), while scores <0 indicate right bias asymmetry (and negative affect). ∗p < 0.05.
