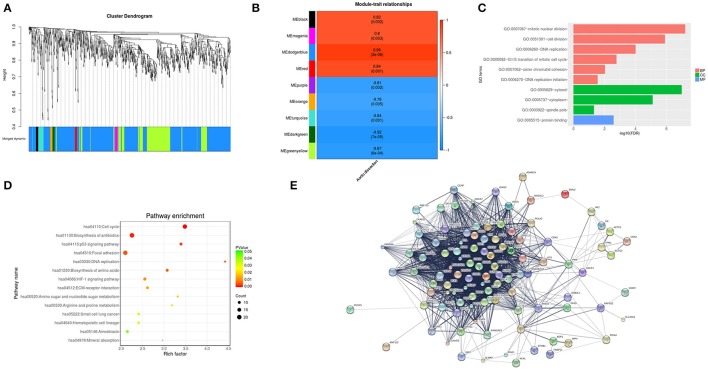
Figure 3.
WGCNA analysis and target module and hub genes screening. (A) Network analysis of gene expression in AAD identifies distinct modules of co-expression genes. (B) Pearson correlation coefficient between the module eigengene of modules and the sample feature vector. Numbers in rectangular represent the correlation coefficients and numbers in brackets indicate the corresponding P values. (C) The significant GO terms that conformed to a P < 0.05 were screened in the dodgerblue module. (D) Fisher's exact test was used to select the significant pathway in the dodgerblue module, identified by a P < 0.05. (E) The constructed PPI networks of the top 10 hub genes in dodgerblue module. GO, Gene ontology; BP, Biological process; CC, Cellular component; MF, Molecular function; PPI, Protein-protein interaction; DEGs, Differentially expressed genes.

