
FIGURE 2.
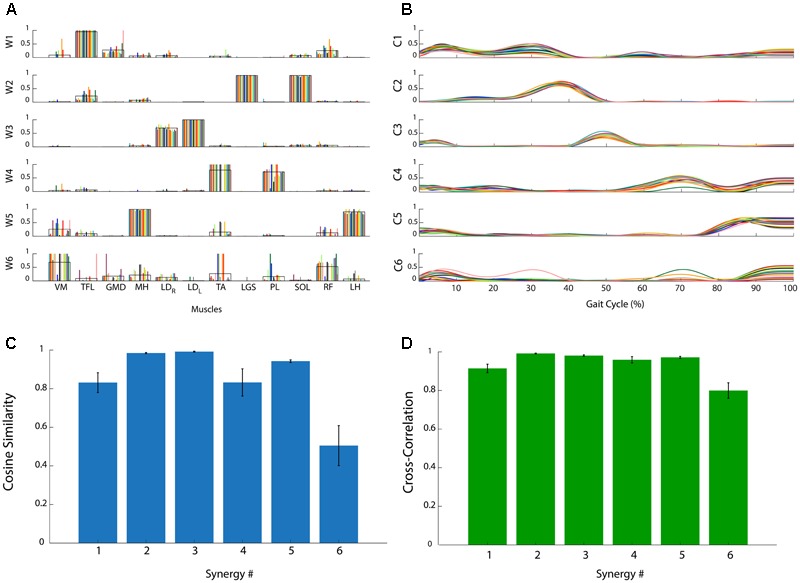
Analysis of the consistency of muscle synergies in a representative subject. (A) Muscle synergy weights (W1, …, W6): each colored bar represents a subgroup of 10 concatenated gait cycles. The black line represents the average across bars. (B) Muscle synergy coefficients (C1, …, C6): each colored line represents a subgroup of 10 concatenated gait cycles. (C) Cosine Similarity for the weights of each synergy. (D) Cross-Correlation coefficient for the activation signals of each synergy. Data are reported as mean ± SEM.