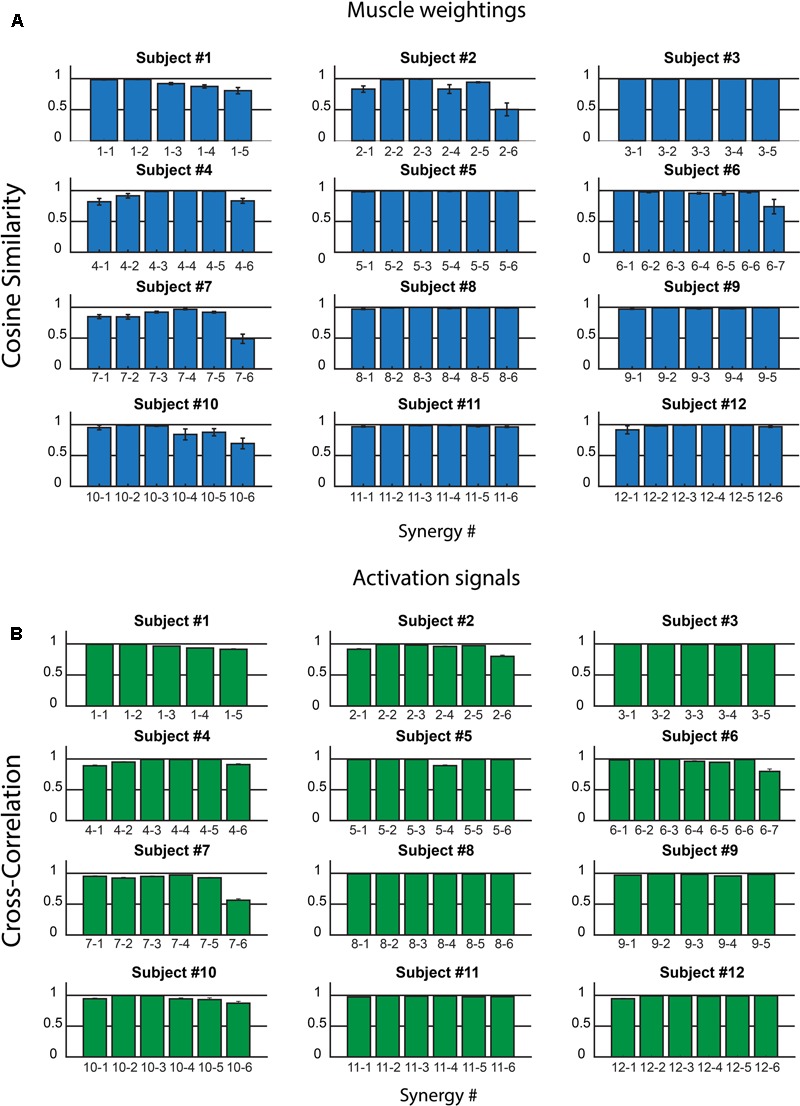
FIGURE 3.

Intra-subject consistency of the muscle synergies in the 12 subjects: Cosine Similarity for the weights (A) and Cross-Correlation for the activation signals (B) are reported. In the x-axis labels, the first number identifies the subject, the second the synergy. Data are reported as mean ± SEM.
