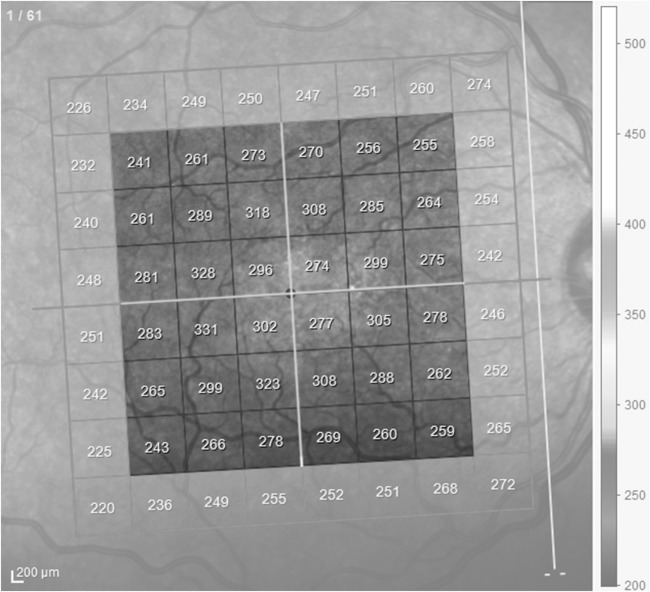
Figure 1.
Demarcation of the area in the macula scanned by spectral domain optical coherence tomography. The enhanced squares represent the area used for analysis, divided into four quadrants and two hemifields (white lines). Note the inclination of the scans due to fovea-disk correction. Peripheral squares were excluded from calculations.

