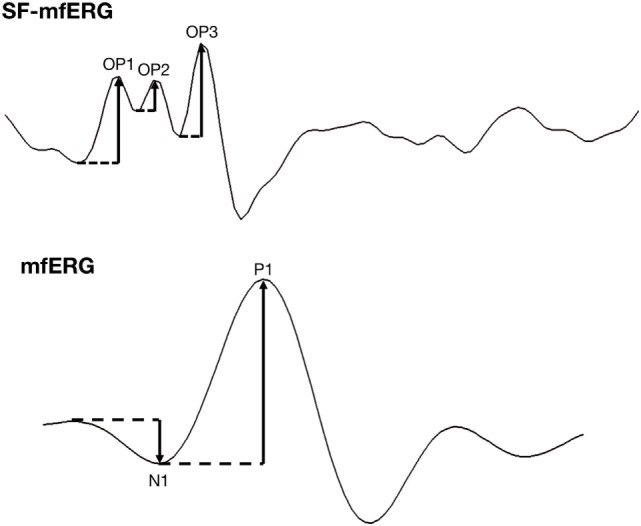
Figure 3.

Spatially summed waveforms of regular and slow-flash mfERG of a 34-year-old healthy control. OP amplitude (upper graph) is the difference in nanovolts between a peak and the preceding trough. The final OP amplitude is the sum of the three amplitudes. In the mfERG waveform (lower graph), the N1 amplitude is the difference in nanovolts between the baseline and the first trough; the P1 amplitude is the difference in nanovolts between the first trough and the first peak.
