Fig. 1.

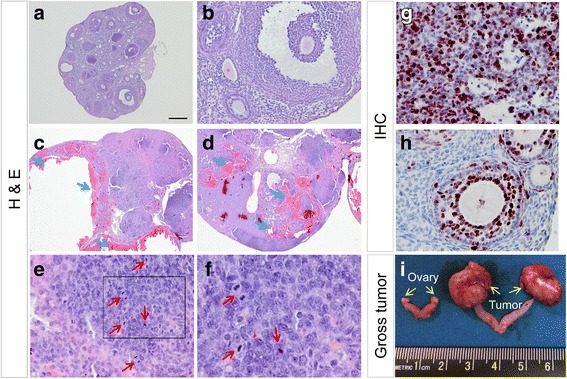
Development of sex cord-stromal tumors in TGFBR1-CAG9Cre mice. a-f Histological analysis of 8-week-old control and TGFBR1-CAG9Cre mice. Note the presence of hemorrhagic cysts (c; blue arrows) and hemorrhage (d; blue arrows) and neoplastic regions containing mitotic figures (e and f; red arrows) in TGFBR1-CAG9Cre ovaries compared with control ovaries (a and b). Panel f is a higher magnification image for the boxed region in panel (e). g and h Immunohistochemical analysis of Ki67 using 8-week-old TGFBR1-CAG9Cre (g) and control (h) ovaries. Experiment was performed using ABC method, and signals were developed using NovaRED Peroxidase Substrate Kit. Sections were counterstained with hematoxylin. Scale bar is representatively depicted in (a) and equals 12.5 μm (f), 25 μm (e, g, and h), 50 μm (b), and 250 μm (a, c, and d). H & E staining and immunohistochemistry were conducted using 3-5 independent samples per group. i Gross ovarian tumor morphology of a 7-month-old mouse. Yellow arrows denote the ovary and ovarian tumors in the control and TGFBR1-CAG9Cre mice, respectively
