Fig. 2.

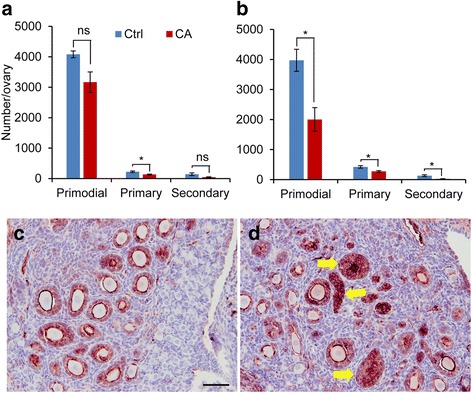
Altered follicular development in TGFBR1-CAG9Cre mice. a and b Follicle counts of control and TGFBR1-CAG9Cre ovaries at PD5 (a) and PD7 (b). Data are mean ± s.e.m. n = 3. * P < 0.05. Ns, not significant. c and d Immunohistochemical localization of INHA in PD7 control and TGFBR1-CAG9Cre ovaries. Arrows indicate abnormal follicle structures. Experiment was performed using ABC method, and signals were developed using NovaRED Peroxidase Substrate Kit. Sections were counterstained with hematoxylin. Four independent samples per group were used for immunohistochemical analyses. Scale bar is representatively depicted in (c) and equals 50 μm (c and d)
