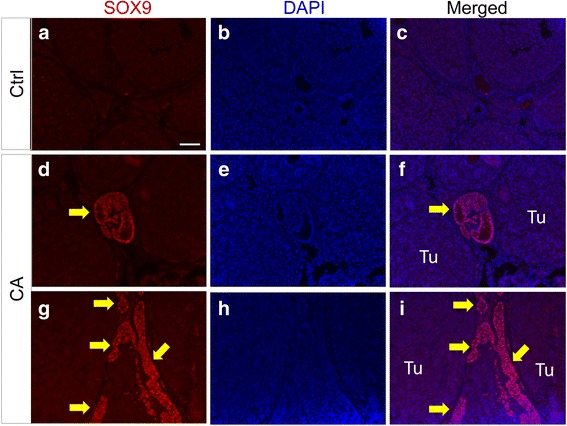
Fig. 5.

Immunofluorescence of SOX9 in control and TGFBR1-CAG9Cre ovaries. a-c SOX9 expression in control ovaries. d-i SOX9 expression in TGFBR1-CAG9Cre ovaries. DAPI (blue) was used to counterstain the nucleus. Arrows indicate abnormal expression of SOX9 proteins (red) in ovarian tumors. At least three control and TGFBR1-CAG9Cre mice at the age of ~2 months were analyzed. The results of immunofluorescence were confirmed by immunohistochemistry (not shown). Tu, tumor. Scale bar is depicted in (a) and equals 50 μm (a-i)
