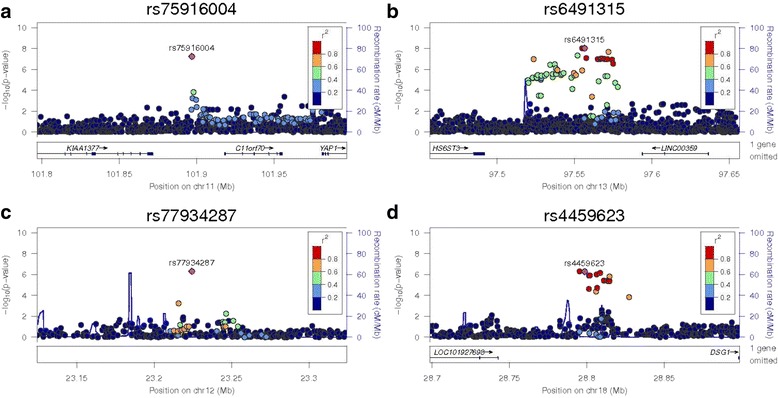
Fig. 4.

Regional association plots for the ‘sentinel’ SNP in 11q22.1, AK094733, HS6ST3 and DSC1. –log10 (p-values) are shown for all SNPs in each region with the color of circles indicating the degree of LD with the most associated SNP in the region. These regions are: a rs75916004 on 11q22.1, b rs77934287 in chromosome 12, c rs6491315 in HS6ST3 and d rs4459623 in DSC1. Observed p-values came from the meta-analysis for all SNPs, except rs6491315 in HS6ST3. This is region with the strongest result in AA-DHS; however, this signal was not replicated in JHS
