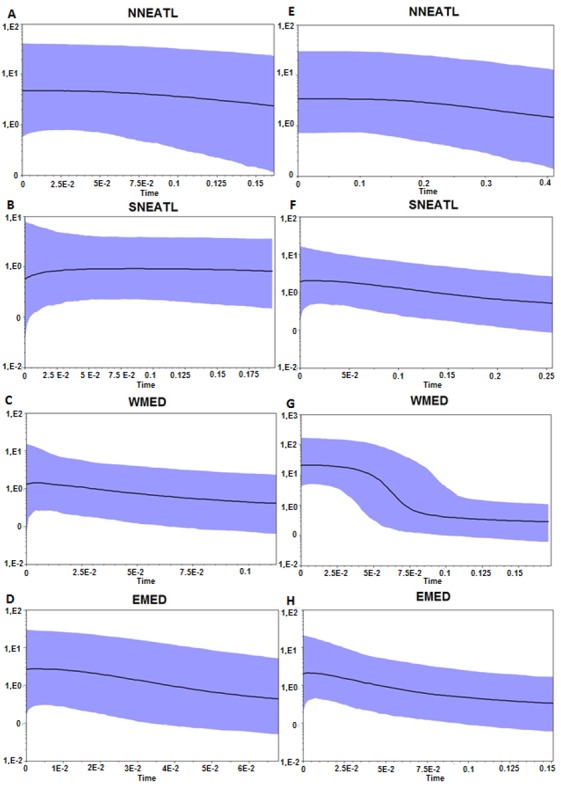
Figure 3. Bayesian Skyline Plot from the Cytb, A–D, and control region, E–H, of the four different geographical areas.

NNEATL: North North–eastern Atlantic; SNEATL: South North–eastern Atlantic; WMED: Western Mediterranean; EMED: Eastern Mediterranean. The Y-axis indicates effective population size (Ne) × generation time, while the X-axis indicates mean time in million of years before present. The thick line represents the average, while the blue band represents 95% highest posterior density (HPD) intervals.
