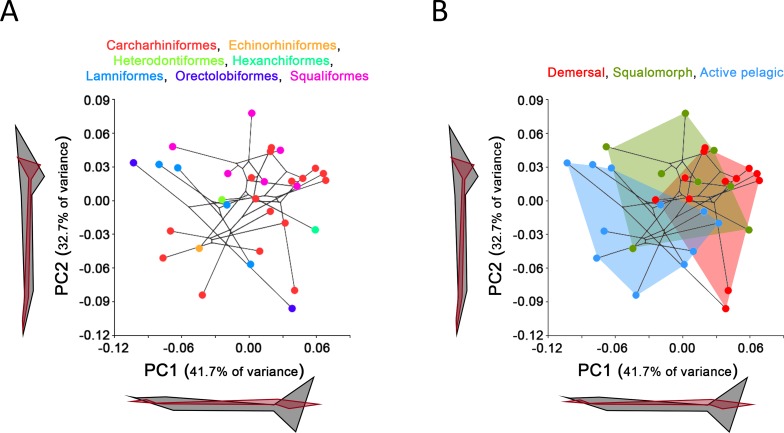
Figure 2. Principal Component Analysis (PCA) results for the whole group of sharks.
PCA plots of the first two PC axes showing the distribution of (A) taxonomic groups at order level and (B) modes of life according to Thomson & Simanek (1997). The phylogenetic tree (modified from Vélez-Zuazo & Agnarsson, 2011) is mapped into the PCA morphospace. Wireframe configurations show shape changes from the negative to the positive extreme of the axes (black and red respectively).

