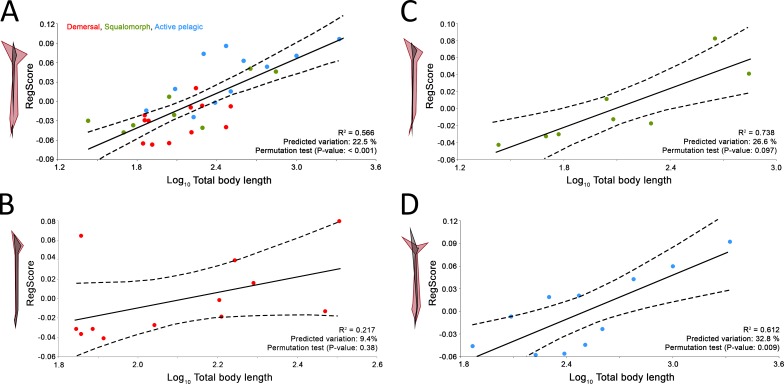
Figure 3. Allometric regression analysis results for (A) the whole group of sharks and the ecological subgroups of (B) demersal, (C) squalomorph and (D) active pelagic shark species.
Wireframe configurations show shape changes from the negative to the positive extreme of the axis (black and red respectively). Upper and lower limits of 95% mean confidence intervals are showed with dashed lines for each regression analysis.

