
Figure 1.
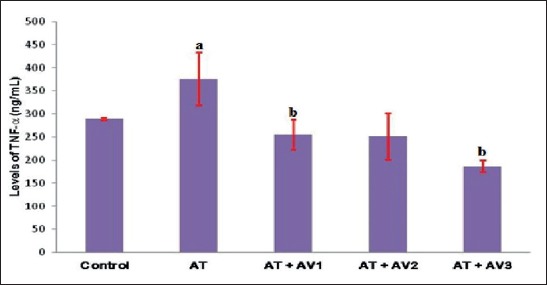
The levels of TNF-a in experimental groups. Data are presented in mean ± standard deviation; a P<0.05 compared to control group; b P<0.05 compared to antituberculosis group; AT: antituberculosis drugs; AV: Aloe vera.
Official websites use .gov
A
.gov website belongs to an official
government organization in the United States.
Secure .gov websites use HTTPS
A lock (
) or https:// means you've safely
connected to the .gov website. Share sensitive
information only on official, secure websites.
The levels of TNF-a in experimental groups. Data are presented in mean ± standard deviation; a P<0.05 compared to control group; b P<0.05 compared to antituberculosis group; AT: antituberculosis drugs; AV: Aloe vera.