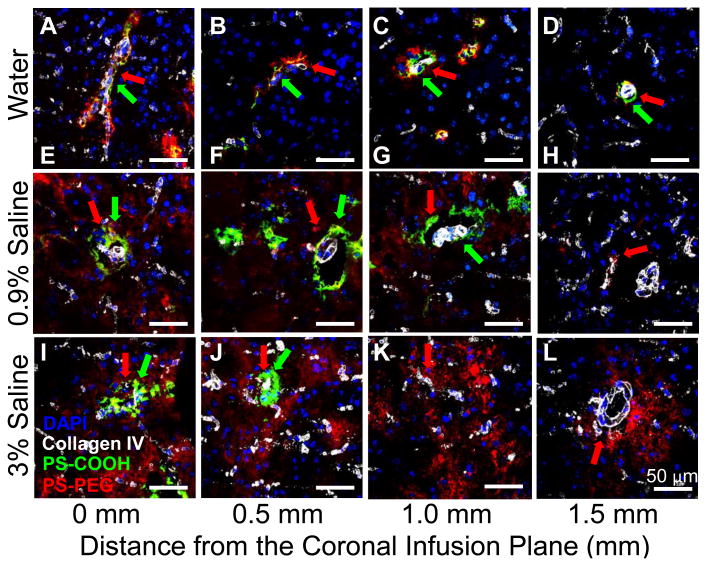
Figure 3. Effect of infusate osmolality on NP distribution in ICS and PVS.
Spatial distribution of PS-PEG (red) and PS-COOH (green) NP in ICS and PVS of the mouse brain following CED at varying osmolality of infusate solutions. NP were infused in (A-D) water, (E-H) 0.9% saline or (I-L) 3% saline. White and blue stains represent blood vessels (collagen IV) and cell nuclei (DAPI), respectively. Red and green arrows indicate distribution of PS-PEG and PS-COOH NP, respectively, in PVS. Representative images depict NP distribution in coronal plans of (A,E,I) infusion site and (B,F,J) 0.5, (C,G,K) 1.0 and (D,H,L) 1.5 mm away. Scale bar = 50 μm.

