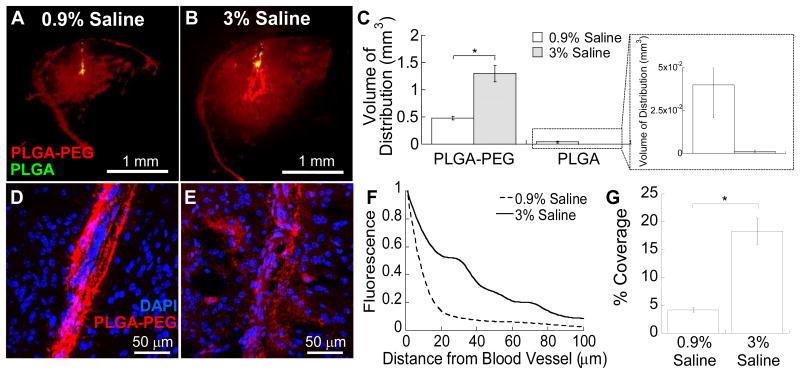
Figure 5. In vivo distribution of PLGA-based NP in mouse striatum following administration via CED.
Representative coronal images of PLGA-PEG (red) and PLGA (green) NP infused in (A) 0.9% saline and (B) 3% saline. Data represent the average of N ≥ 3 mouse brain specimen for each condition. (C) Quantified Vd of PLGA-PEG and PLGA NP in mouse striatum. Inset depicts the amplified view of PLGA Vd. *p < 0.05 denotes statistical significant difference. High magnification images of PLGA-PEG NP near lateral striate arteries following infusion in (D) 0.9% saline and (E) 3% saline. Blue indicates cell nuclei (DAPI). (F) Relative distribution of NP in PVS away from the striate arteries. (G) Percent coverage of PLGA-PEG NP fluorescence within the brain ICS calculated using image-based MATLAB quantification. Statistical significant difference is denoted by *p < 0.05.

