
Figure 4. OCTA and Fluorescein Angiography (FA) of Diabetic Retinopathy.
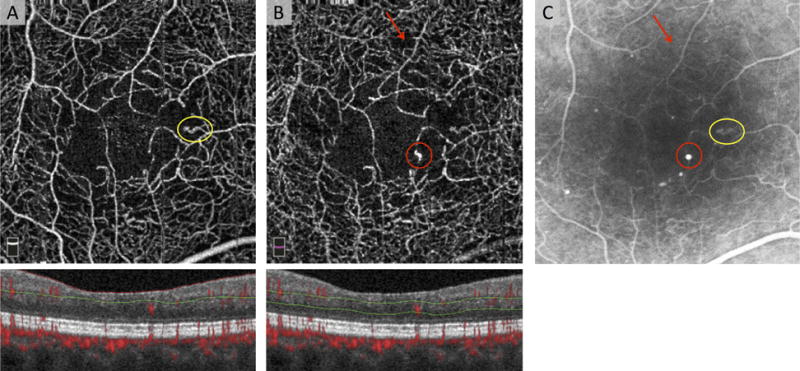
OCTA of the (A) superficial capillary plexus (SCP), and (B) deep capillary plexus (DCP) with cross-sectional OCTA below including red flow overlay, and red and green segmentation boundaries. Note that many of the vessels in the SCP (A) are also seen in the DCP (B) due to projection artifact. (C) Corresponding FA. The yellow circle on in C corresponds to an abnormal, dilated capillary loop that is seen in the SCP (A). This loop is also seen in the DCP, but this is likely due to projection artifact. The red circle in C corresponds to a microaneurysm that is only visible in the DCP (B). The red arrow points to an area of capillary non-perfusion that is better delineated with OCTA, but is not appreciated as clearly on FA due to dye leakage.